10 Python Tips for High-Performance ML Backends (2)
This article is a translated version of my article posted on Hyperconnect Tech Blog, originally written in Korean at May 2023.
한국어 포스트를 보시려면 위 링크를 클릭해주세요.
Article by Youngsoo Lee (me), Suhyun Lee, and Gunjun Lee. Hyperconnect, May 2023.
This is second part of the article. Read previous part.
Table of Contents
Part 1
1. GC can be a bottleneck in some cases. You can tune when GC runs.
2. Built-in lists aren’t always fast — use array or numpy when needed
3. Multiprocessing has high communication overhead — be careful in low-latency scenarios
4. If you’re using PyTorch in a multiprocess environment, adjust num_threads
5. Pydantic is very slow — avoid it when not needed
Part 2 (current)
6. Creating a Pandas DataFrame is slow. Use it carefully.
7. The default json package is slow. Use orjson or ujson.
8. Classes are not always fast. Use dict if performance is an issue.
9. Python 3.11 is less slow
10. (Bonus) How to use line profiler
#6 Creating a Pandas DataFrame takes time — use it carefully
Many ML engineers use Pandas [6-1] for data analysis and preprocessing. While Pandas is built on top of NumPy [6-2], it can still be slower than expected if used carelessly — especially when working with DataFrame. The process of creating and transforming data in a DataFrame can be more expensive than you might think.
Example: How fast is pandas?
Let’s look at how slow pandas.DataFrame can be. The code below creates 1,000 dictionaries with 50 fields each, and performs null value imputation (replacing None with 0.0). We compare the speed of using DataFrame.fillna() vs. a pure Python loop.
import random
import timeit
from typing import Dict, Optional
import pandas as pd

def create_sample_dict() -> Dict[str, Optional[float]]:
    d = {}
    for i in range(50):
        d[f"feature{i}"] = random.random() if random.random() < 0.9 else None
    return d

data_list = [create_sample_dict() for _ in range(1000)]

def null_imputation_using_df():
    df = pd.DataFrame(data_list)
    return df.fillna(0.0)

def null_imputation_in_pure_python():
    ret = []
    for data in data_list:
        new_data = data.copy()
        for key, val in new_data.items():
            if val is None:
                new_data[key] = 0.0
        ret.append(new_data)
    return ret

elapsed_time = timeit.timeit(null_imputation_using_df, number=1)
print(f"pandas.DataFrame: {elapsed_time * 1000:.2f}ms")

elapsed_time = timeit.timeit(null_imputation_in_pure_python, number=1)
print(f"pure python: {elapsed_time * 1000:.2f}ms")
Output:
pandas.DataFrame: 6.91ms
pure python: 1.78ms
Pure Python is over 3 times faster. Even though Pandas uses NumPy internally, it turns out the DataFrame constructor takes most of the time — not fillna().
The structure of pandas.DataFrame
Pandas uses a column-oriented structure [6-3, 6-4]. Each column is stored as a separate NumPy array (ndarray).
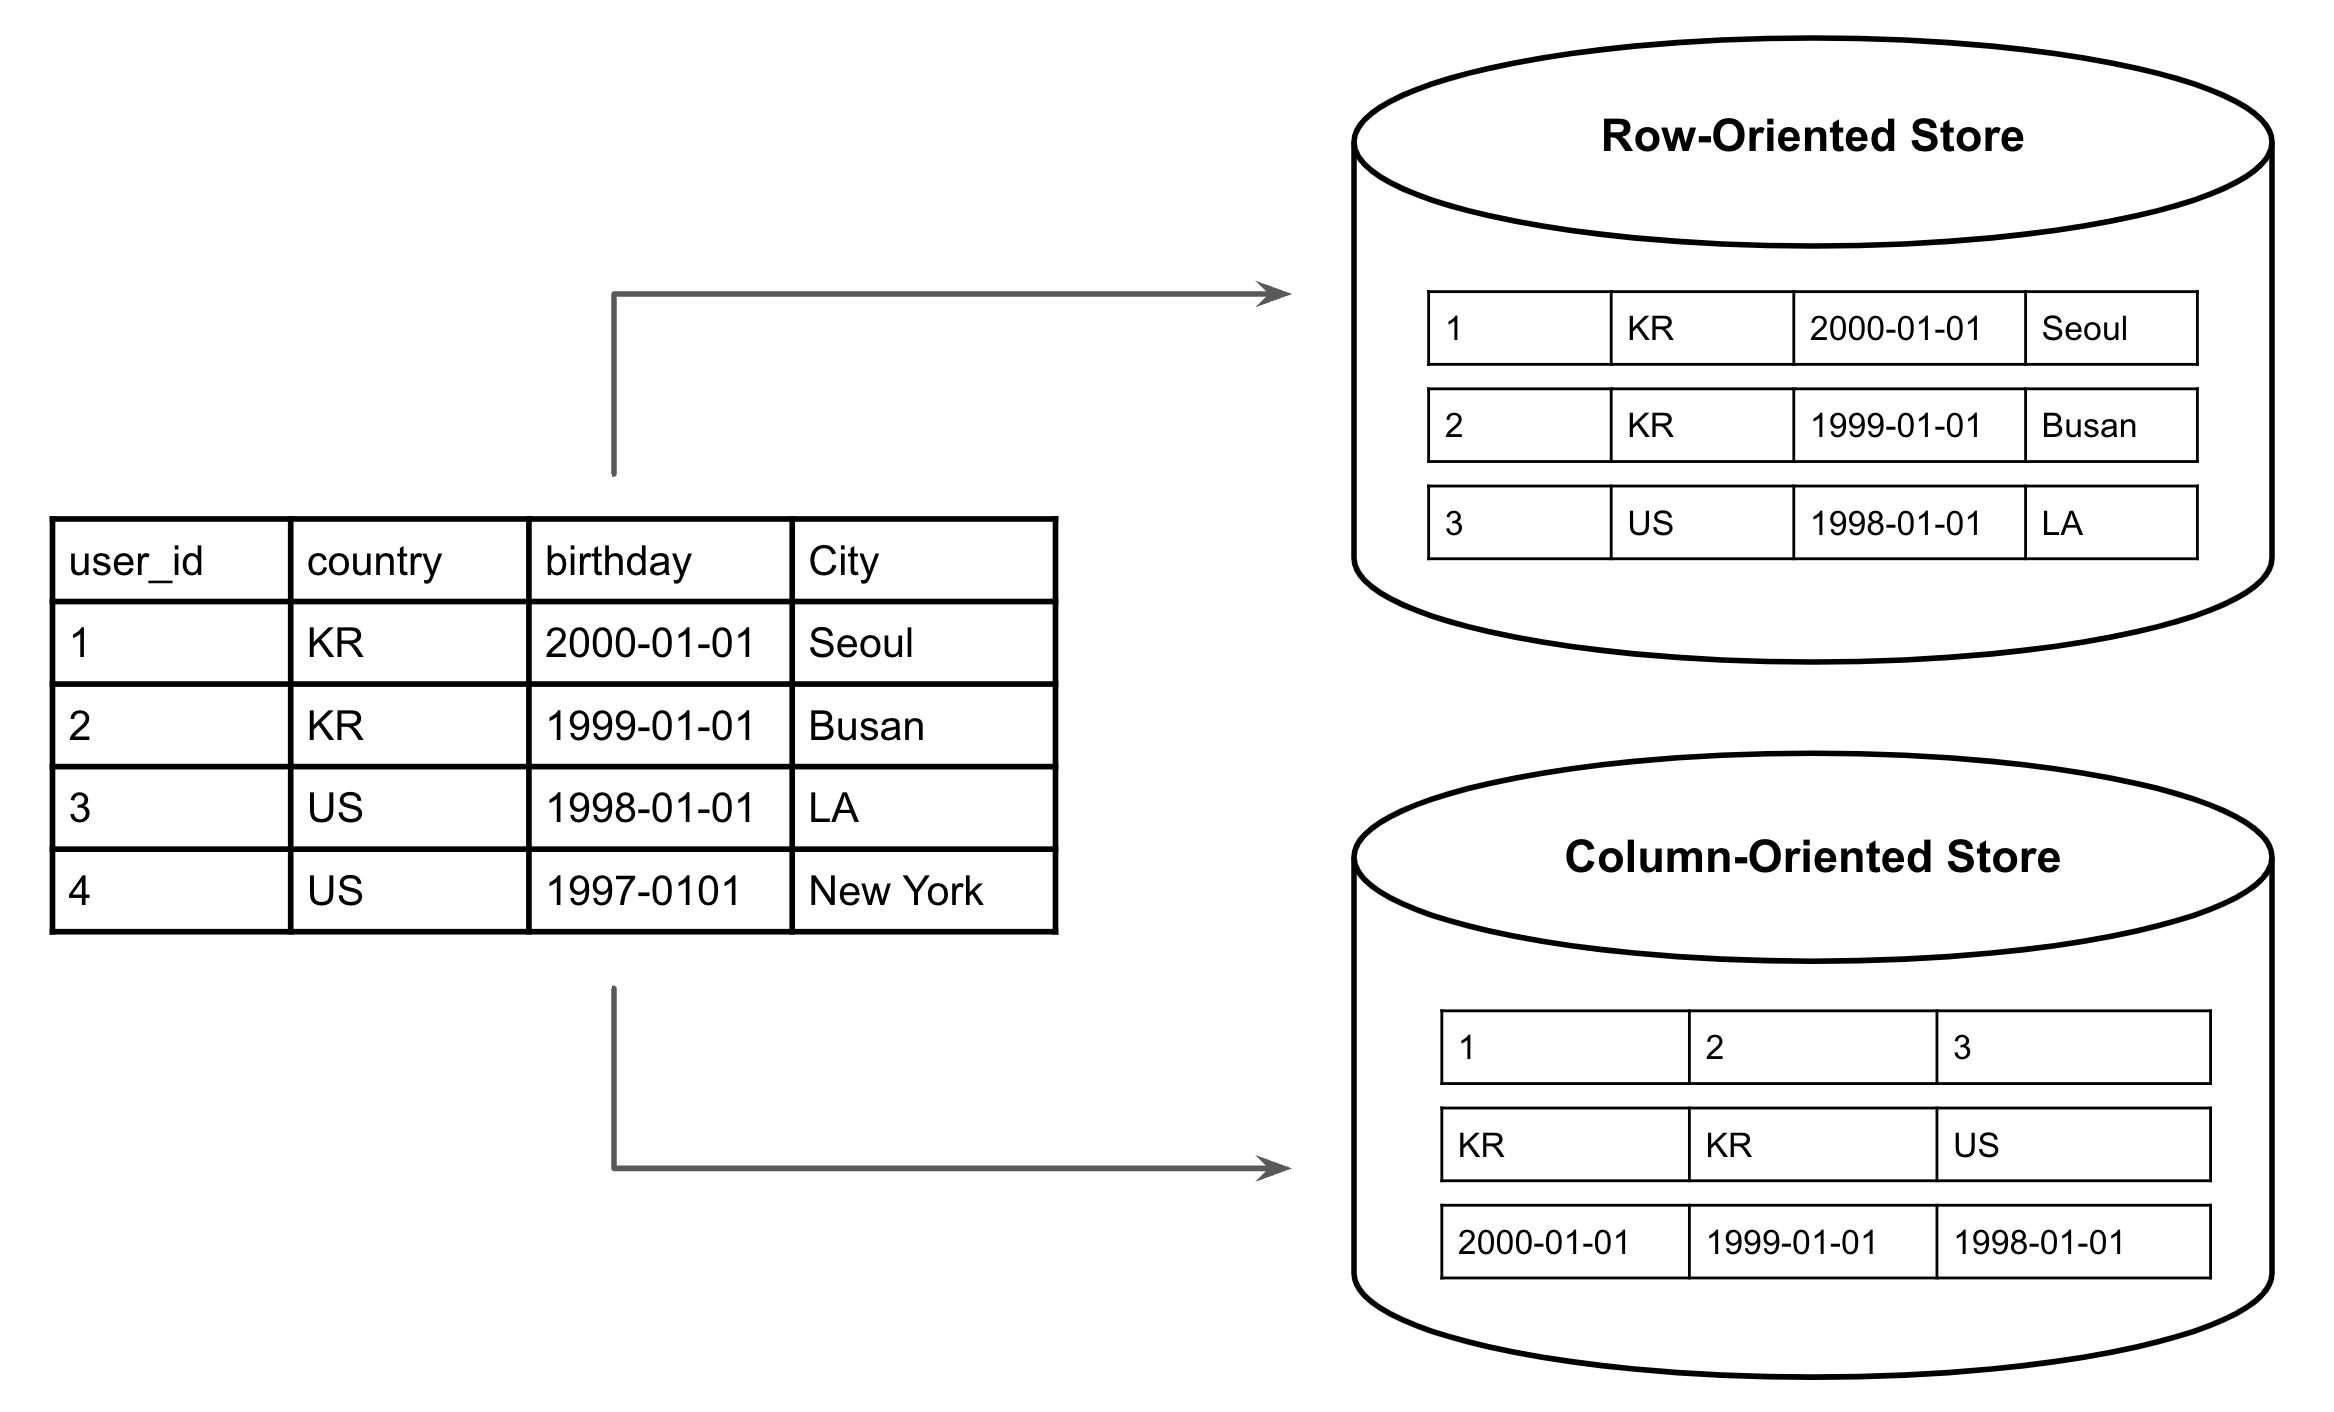 Column-oriented vs Row-oriented storage
For example, this DataFrame:
df = pd.DataFrame([
  {"id": 111, "rating": 5.0, "category": "TRAIN"},
  {"id": 222, "rating": 4.5, "category": "BUS"},
  {"id": 333, "rating": 4.0, "category": "METRO"},
  {"id": 444, "rating": 3.5, "category": "METRO"},
])
Internally becomes:
id       -> ndarray([111, 222, 333, 444], dtype=np.int32)
rating   -> ndarray([5.0, 4.5, 4.0, 3.5], dtype=np.float32)
category -> ndarray(["TRAIN", "BUS", "METRO", "METRO"], dtype='O')
This structure is great for column-wise operations, like:
df["rating"] = df["rating"] * 2
Only one column needs to be changed, so it’s very fast.
But building a DataFrame from a list of dicts involves:
- Reorganizing the data into columns (rebuilding memory layout)
- Inferring the
dtypefor each column
These steps require scanning all the input data and take time.
How to use DataFrame efficiently
If you don’t need to do many column-wise operations, it’s better to avoid using DataFrame. If you do need them, try passing a NumPy array instead of a list of dicts — this reduces preprocessing and dtype guessing time.
Here’s how you can rewrite the original example to be faster:
import numpy as np
(...)
def null_imputation_using_df():
    arr = np.array([list(d.values()) for d in data_list], dtype=np.float32)
    df = pd.DataFrame(arr, columns=list(data_list[0].keys()))
    return df.fillna(0.0)
pandas.DataFrame: 2.35ms
This is about 2x faster.
Hyperconnect’s Case
At Hyperconnect, we found that in most backend and model servers, creating a DataFrame took more time than using it. So we replaced DataFrame logic with plain Python and NumPy. In some services, this reduced P99 latency by over 50% and doubled throughput.
#7 Python’s built-in json is slow — use orjson or ujson
In ML systems, we often use JSON — for passing features, model input/output, or communicating with web servers. Python’s built-in json module is widely used and very convenient, as it easily converts between JSON strings and Python dicts/lists.
But it’s not fast. Python’s built-in json is implemented in pure Python, and it can become a bottleneck, especially with large or deeply nested JSON data.
So what can we do? Fortunately, there are faster third-party libraries like orjson [7-1] and ujson [7-2]. These are implemented in Rust or C and are optimized for performance with large data.
Here’s an example comparing the speed of parsing a JSON string with 1,000 fields using different libraries:
import json
import random
import timeit

import ujson
import orjson

sample_dict = {}
for i in range(1000):
    sample_dict[f"feature{i}"] = random.random()
json_string = json.dumps(sample_dict)

def test_json():
    return json.loads(json_string)

def test_ujson():
    return ujson.loads(json_string)

def test_orjson():
    return orjson.loads(json_string)

num_runs = 100

json_time = timeit.timeit(test_json, number=num_runs)
ujson_time = timeit.timeit(test_ujson, number=num_runs)
orjson_time = timeit.timeit(test_orjson, number=num_runs)

print(f'json: {json_time * 1000:.1f} ms')
print(f'ujson: {ujson_time * 1000:.1f} ms')
print(f'orjson: {orjson_time * 1000:.1f} ms')
Results:
json: 36.5 ms
ujson: 14.4 ms
orjson: 8.6 ms
Compared to the built-in json, ujson is over 2x faster, and orjson is over 4x faster. So if you deal with a lot of JSON parsing, switching libraries can give a noticeable performance boost.
Hyperconnect’s Case
Some of our model-serving servers at Hyperconnect receive large JSON payloads with many features. After switching from the built-in json to orjson, we saw a 5–10% improvement in P99 latency.
#8 Classes may not be fast enough — use dict if performance becomes an issue
Creating a few class instances is usually not a problem. But when you need to create thousands of them, even the speed of class creation can become a bottleneck.
Here’s an example comparing the time to create 2,000 objects using a class with 30 attributes vs. using a dict:
import timeit

NUM_INSTANCES = 2000

class FeatureSet:
    def __init__(
        self, user_id: int,
        feature1: float, feature2: float, (...) feature30: float,
    ):
        self.user_id = user_id
        self.feature1 = feature1
        self.feature2 = feature2
        (...)
        self.feature30 = feature30

def create_class_instances() -> None:
    for i in range(NUM_INSTANCES):
        obj = FeatureSet(
            user_id=i,
            feature1=1.0 * i,
            feature2=2.0 * i,
            (...)
            feature30=30.0 * i,
        )

def create_dicts() -> None:
    for i in range(NUM_INSTANCES):
        obj = {
            "user_id": i,
            "feature1": 1.0 * i,
            "feature2": 2.0 * i,
            (...)
            "feature30": 30.0 * i,
        }

class_time = timeit.timeit(create_class_instances, number=1)
print(f"class: {class_time * 1000:.1f}ms")

dict_time = timeit.timeit(create_dicts, number=1)
print(f"dict: {dict_time * 1000:.1f}ms")
Example output (Python 3.8):
class: 8.0ms
dict: 2.9ms
So the class version is over 2.5x slower. While a 5ms difference may seem small, this gap grows with more properties or more instances.
Using __slots__ [8-1] can reduce memory usage, but doesn’t help much with speed. Switching to dataclass also doesn’t improve performance significantly.
Also, if you’re using many properties and generating many instances, avoid using **kwargs with setattr. It’s tempting because it saves typing, but it adds function call overhead and can be twice as slow as directly setting attributes.
Of course, managing everything with dicts instead of classes can hurt code quality and maintainability. But if performance is critical in a small, specific part of your code, using dict instead of class might be worth considering.
Note: Python 3.11 improves class performance. See the next section for details.
Hyperconnect’s Case
In some performance-critical parts of Hyperconnect’s services where we create thousands of objects, class creation itself became a bottleneck. In those cases, we switched to dict — but only in very limited places, since using dicts disables static type checking tools like mypy.
#9 Python 3.11 is less slow
Python 3.11, released in October 2022, brought major performance improvements [9-1]. In this section, we’ll focus on one specific improvement: class construction speed.
In Python 3.11, the process of initializing class instances was optimized, making object creation faster. Let’s compare how long it takes to create a dict, class, and dataclass with three attributes:
import timeit
from dataclasses import dataclass

ITERATIONS = 100000

class MyClass:
    def __init__(self, key1, key2, key3):
        self.key1 = key1
        self.key2 = key2
        self.key3 = key3

@dataclass
class MyDataclass:
    key1: int
    key2: int
    key3: int

def create_dict():
    my_dict = {"key1": 1, "key2": 2, "key3": 3}

def create_class():
    MyClass(1, 2, 3)

def create_dataclass():
    MyDataclass(1, 2, 3)

dict_time = timeit.timeit(create_dict, number=ITERATIONS)
class_time = timeit.timeit(create_class, number=ITERATIONS)
dataclass_time = timeit.timeit(create_dataclass, number=ITERATIONS)

print(f"dictionary creation time: {dict_time * 1000:.2f} ms")
print(f"class creation time: {class_time * 1000:.2f} ms")
print(f"dataclass creation time: {dataclass_time * 1000:.2f} ms")
Results:
# Python 3.10
dictionary creation time: 9.30 ms
class creation time: 23.05 ms
dataclass creation time: 22.30 ms

# Python 3.11
dictionary creation time: 9.45 ms
class creation time: 13.45 ms
dataclass creation time: 12.90 ms
In Python 3.11, class and dataclass creation is about 1.7x faster compared to 3.10. Still, creating a class is ~1.4x slower than creating a dict — this is because classes internally use dicts and add more overhead.
If class creation is your performance bottleneck, upgrading to Python 3.11 can help. But be careful: as of May 2023, some libraries may not yet support Python 3.11. Check compatibility before upgrading.
If you’re curious about how Python 3.11 improved class creation, this article explains it well. For a more complete list of Python 3.11 improvements, see the official release notes.
Hyperconnect’s Case
After upgrading a recommendation API server from Python 3.8 to Python 3.11, we saw a 5–10% reduction in average latency.
#10 (Bonus) How to use line profiler
So far, we’ve shared several performance optimization tips that Hyperconnect discovered while running ML backend servers using Python. But in reality, performance bottlenecks can change depending on the situation. To build high-performance ML backends, it’s not just about knowing many Python tricks — what matters most is the ability to diagnose and solve performance problems when they happen. And the first step in solving performance issues is to identify the bottleneck.
line_profiler
One simple and useful tool for finding bottlenecks in Python code is line_profiler. As the name suggests, it measures execution time line by line for Python functions. There are other powerful tools like cProfile, but line_profiler makes it easier and more intuitive to see where the slowdown is happening.
Here’s a quick guide to using line_profiler:
$ pip install line_profiler
Then, add the @profile decorator to the function you want to profile:
@profile
def slow_function(a, b, c):
    ...
Now, run the script using kernprof:
$ kernprof -lv main.py
You’ll see profiling output like this:
Wrote profile results to line_p.py.lprof
Timer unit: 1e-06 s

Total time: 2.86632s
Function: func at line 3

Line #      Hits         Time  Per Hit   % Time  Line Contents
==============================================================
     3                                           @profile
     4                                           def func():
     5        10      85541.0   8554.1      3.0      a = np.random.random((1000, 1000))
     6        10      76209.0   7620.9      2.7      b = np.random.random((1000, 1000))
     7       110        473.0      4.3      0.0      for _ in range(10):
     8       100    2704098.0  27041.0     94.3          a @ b
Profiling in cloud environments
In cloud or production-like environments, using kernprof can be difficult — for example, if you want to test with real inputs in a staging environment.
Fortunately, line_profiler also provides an API you can use inside your Python code. Here’s an example of how to run profiling inside an endpoint:
from fastapi import FastAPI
import numpy as np
from line_profiler import LineProfiler

app = FastAPI()

def heavy_func(n):
    a = np.random.random((n, n))
    b = np.random.random((n, n))
    return np.sum(a + b)

profiler = LineProfiler()
wrapped_heavy_func = profiler(heavy_func)

@app.get("/api")
async def api():
    result = wrapped_heavy_func(100)
    profiler.print_stats()
    return result
When you send a request to /api, profiler.print_stats() will output profiling results like this:
Function: heavy_func at line 7

Line #      Hits         Time  Per Hit   % Time  Line Contents
==============================================================
     7                                           def heavy_func(n):
     8         1     361000.0 361000.0     43.1      a = np.random.random((n, n))
     9         1     139000.0 139000.0     16.6      b = np.random.random((n, n))
    10         1     337000.0 337000.0     40.3      return np.sum(a + b)
At Hyperconnect, we’ve used line_profiler to identify many bottlenecks. In fact, many of the tricks we shared in this blog post were discovered through profiling. Sometimes, code that looks slow turns out to be fine, and vice versa — profiling is the only way to know for sure.
Profiling may seem like a hassle at first, but it’s the most effective way to pinpoint and fix performance issues. So, whenever you feel your Python code is slow, start by profiling to see where and how much it’s slowing down. Once you find the bottleneck, optimization becomes much easier.
In Closing
This post shared Python performance optimization tips from Hyperconnect to help those struggling with Python’s slower execution speed. More importantly, we hope it conveyed this message: beyond tricks and tweaks, understanding how Python works, analyzing your own code, and applying profiling tools thoughtfully can absolutely help you meet the performance needs of your business.
Thanks for reading this long post!
References
[6-1] https://pandas.pydata.org/
[6-2] https://en.wikipedia.org/wiki/Pandas_(software)
[6-3] https://dkharazi.github.io/blog/blockmanager
[6-4] https://uwekorn.com/2020/05/24/the-one-pandas-internal.html
[7-1] https://github.com/ijl/orjson
[7-2] https://github.com/ultrajson/ultrajson
[8-1] https://wiki.python.org/moin/UsingSlots
[9-1] https://medium.com/aiguys/how-python-3-11-is-becoming-faster-b2455c1bc555